Sales Dashboard
How to use the real-time sales dashboard.
Sales Dashboard
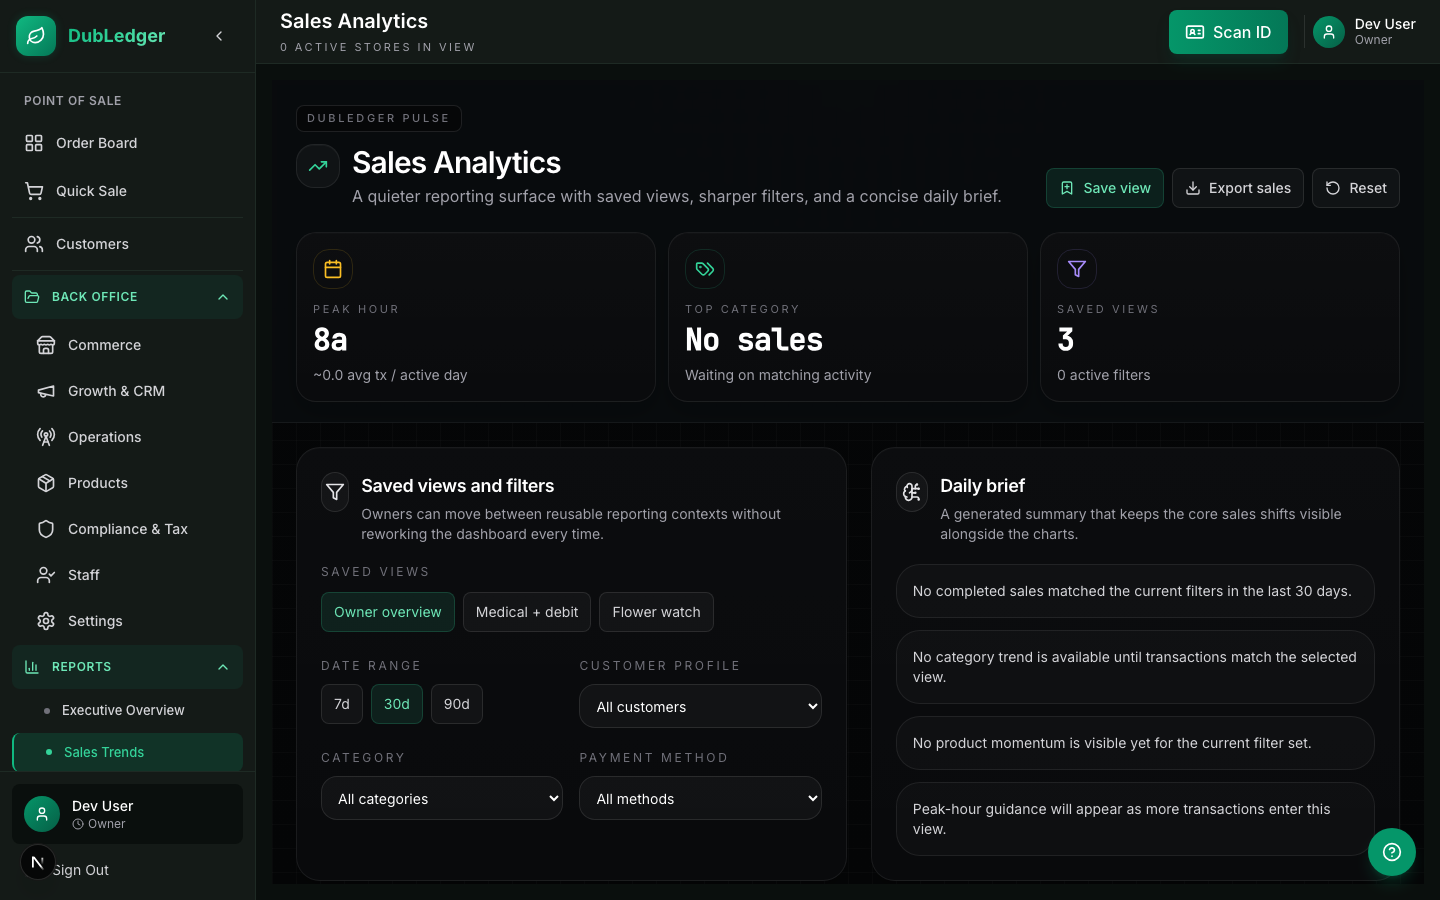
The Sales Dashboard provides real-time performance metrics from transaction data.
Key metrics cards
- Total Revenue: today's sales revenue.
- Transaction Count: number of transactions today.
- Average Basket Size: average transaction value.
- Items Sold: total units sold today.
- Unique Customers: number of distinct customers today.
- Compliance Score: current compliance health score.
Trend indicators compare today to the same metric yesterday, last week, or last month.
Chart views
Revenue chart
- Line chart showing revenue by hour.
- Toggle between today, yesterday, last 7 days, and last 30 days.
Transaction chart
- Bar chart showing transaction count by hour.
- Use it to identify peak hours and slow periods.
Category breakdown
- Pie chart showing revenue by product category.
- Hover for dollar amounts and percentages.
Top products
- Best Sellers: ranked list of top-selling products today, with units sold, revenue, and remaining inventory.
- Click a product to view details or reorder.
Notes
- The dashboard reflects only cash transactions because cash is the only supported payment method.
- Data updates as transactions are completed.